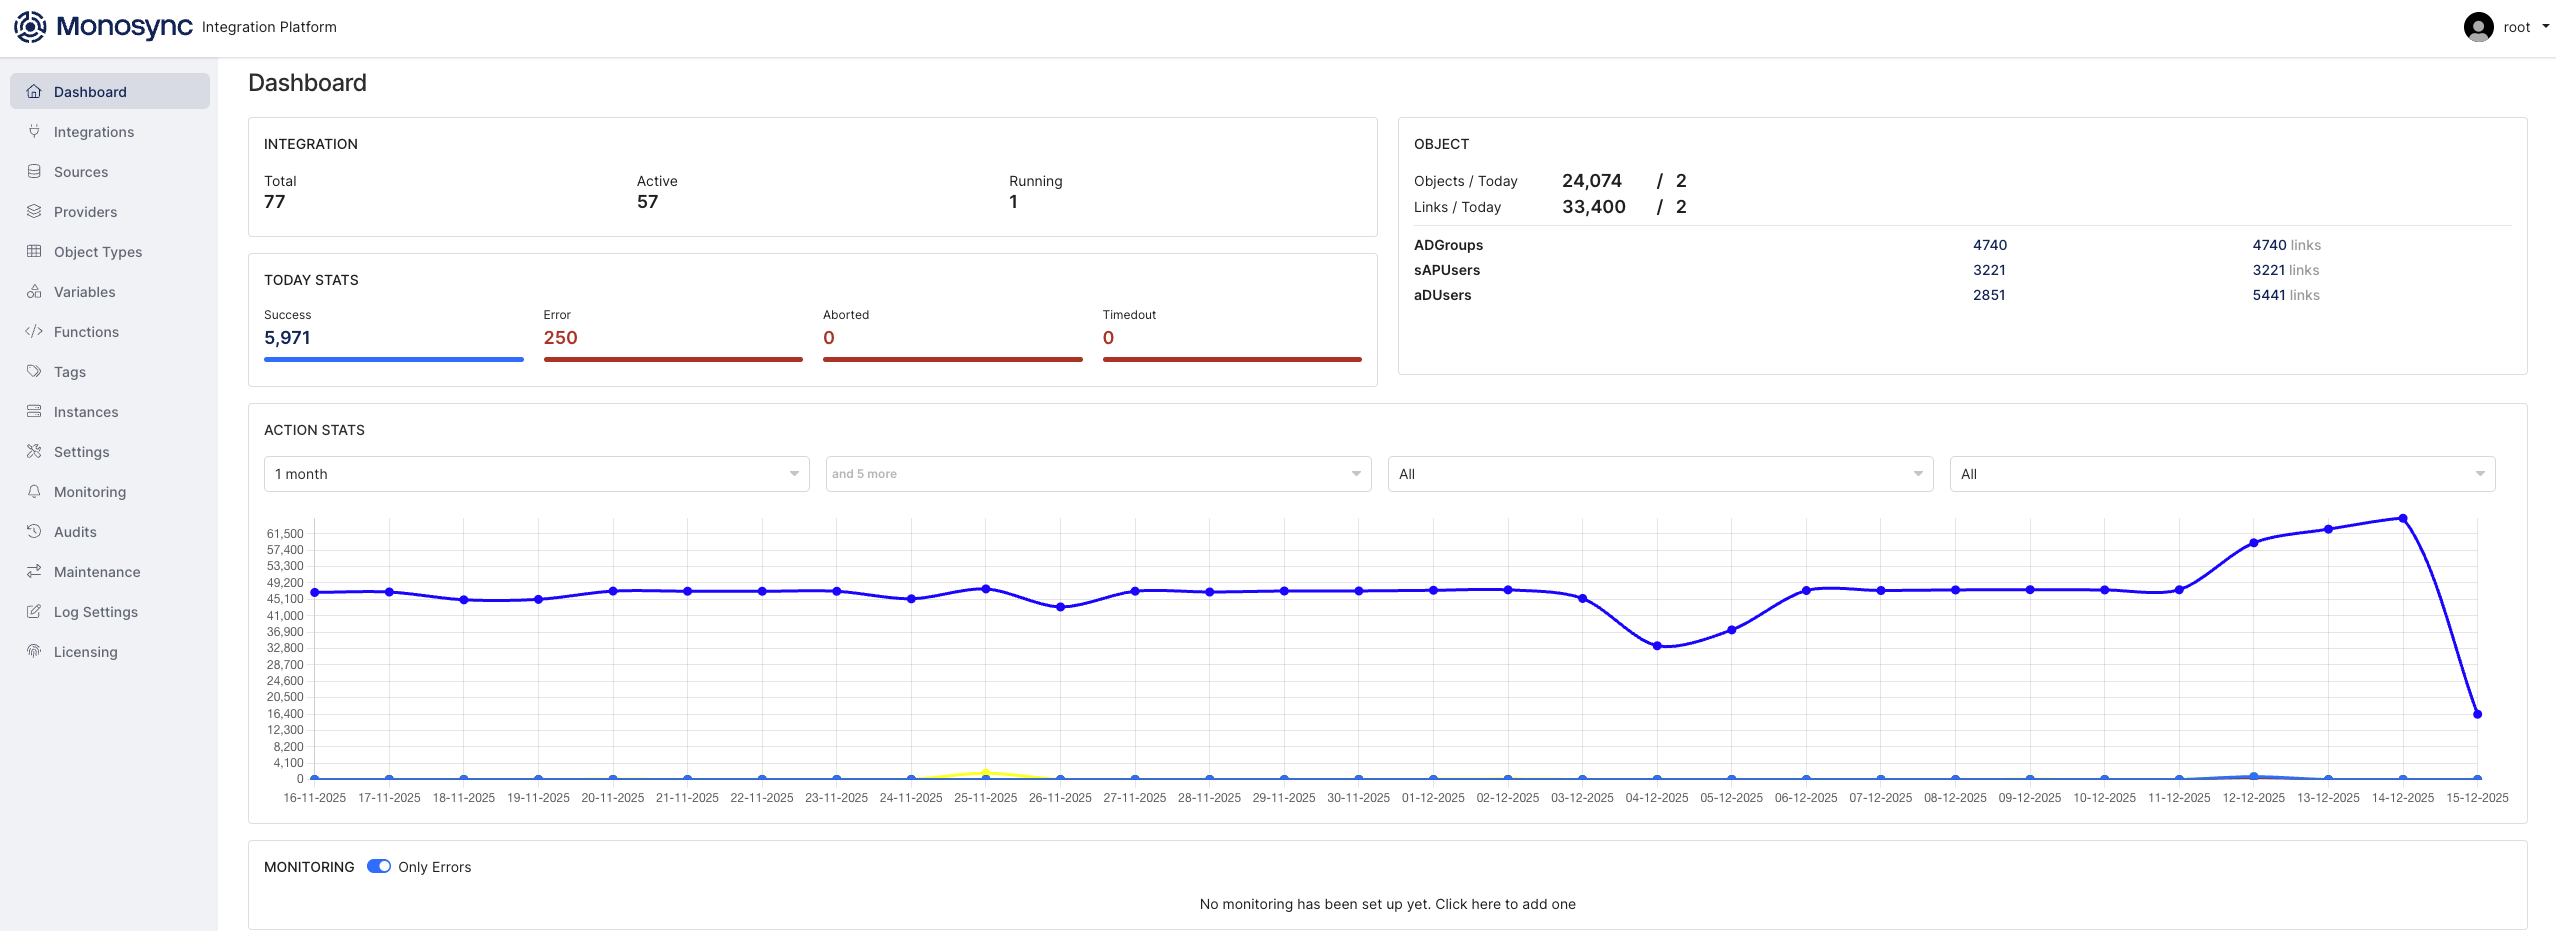
This overview shows the Monosync Integration Platform dashboard, which reflects overall integration performance and object management within the system. The current status of the platform is that multiple integrations are presently running, partly active, and partly running at this moment. Today's statistics demonstrate good performance: successful operations strongly outbalance errors, and no operations have been aborted or timed out, which is indicative of a healthy overall success rate.
The system is monitoring several object types, processing both objects and links throughout the day. Generally, as the action statistics graph for the past month shows, the activity level remains stable throughout the monitoring period, although there is a sharp decline at the tail of the timeline when the level of activity drops dramatically. This rapid drop can point to a scheduled period of maintenance, lower system usage, or perhaps an issue to be investigated. Currently, the monitoring section is set to track only errors, although no rules of monitoring have been set yet-a fact that might indicate this could be a place for future configuration if more thorough system monitoring is desired.